New in Expensify: Home page launch and upgraded Insights analytics

We’re excited to announce a double update in New Expensify: a brand-new Home experience to streamline your day-to-day tasks and a powerful new Insights dashboard that turns your company’s spend data into meaningful, visual intelligence.
TL;DR – What’s new in New Expensify
- New Home page organizes tasks, approvals, and training in one place
- Time-sensitive alerts and step-by-step task prompts keep you moving
- Upgraded Insights lets you track spend by employee, vendor, or category
- Visualize spend data with pie charts, bar graphs, and trend lines
- Drill down into grouped expenses or save custom reports for easy sharing
A new Home for your expenses
The redesigned Home page is built around one goal: remove busywork. Employees and admins now land on a simplified, widget-based layout that highlights exactly what needs attention and helps you act on it faster.
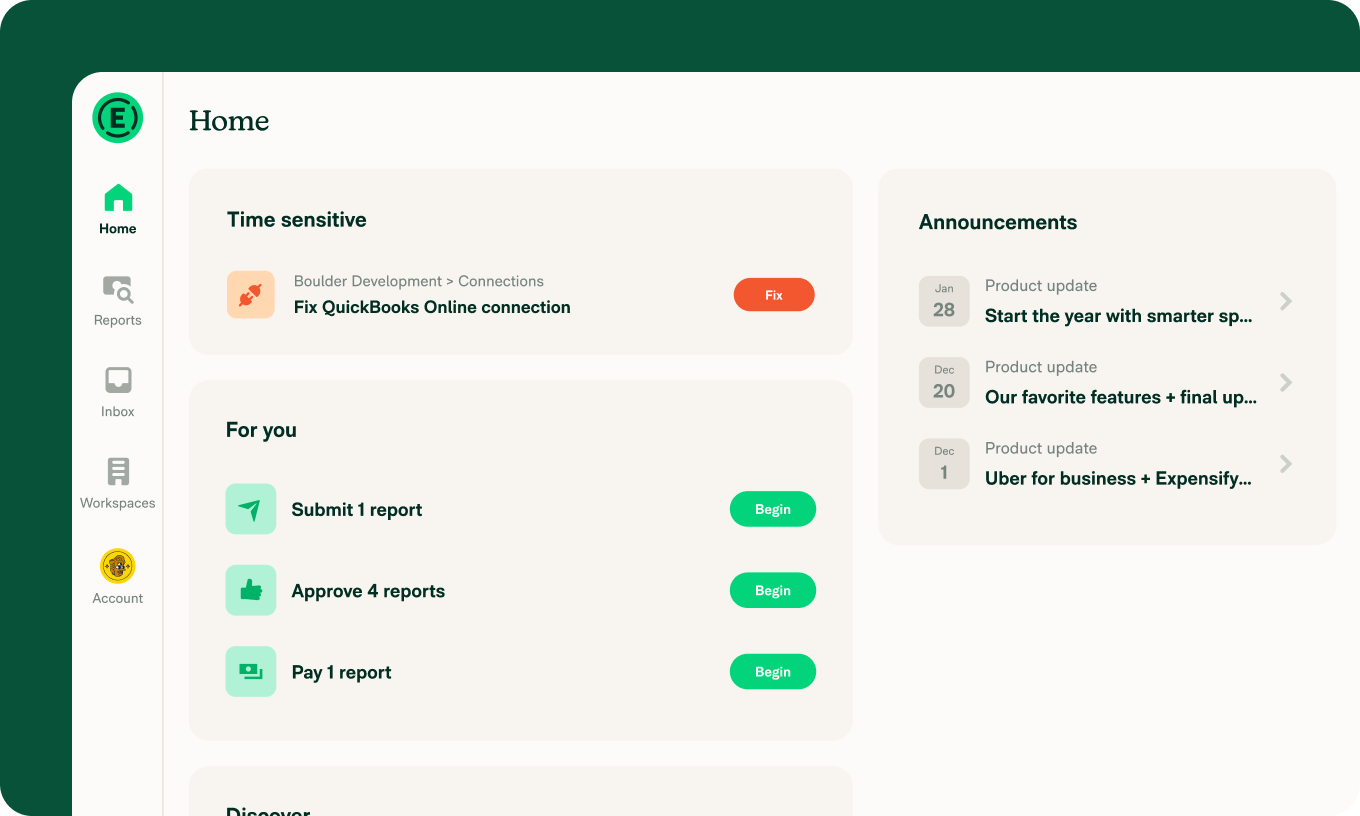
What to expect
Proactive alerts: Highlights time-sensitive tasks first, with contextual guidance built in.
Open task management: Quickly view and manage outstanding expense submissions, approvals, and payments, all in one place.
On-demand training: A dedicated training widget links to an interactive demo covering the basics of New Expensify.
Charting a course for financial intelligence
We’ve also upgraded the Insights experience with new charting tools and analytics on the Reports page. Admins now get a visual, configurable look at company spend patterns in just a few clicks.
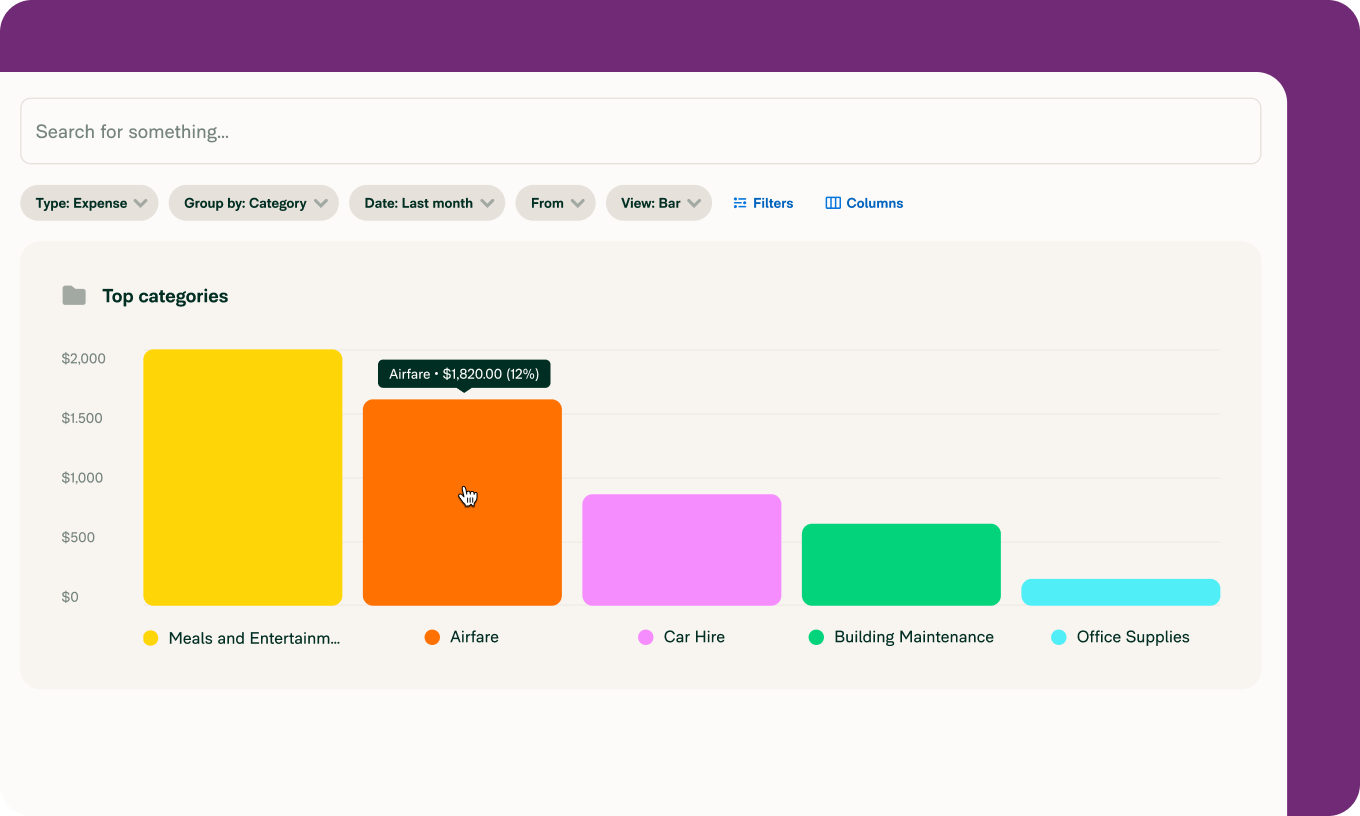
Insights & Analytics includes:
Track employee and category spend, spend-over-time trends, vendor concentration, and duplicate subscriptions
Generate executive-style reporting at a glance with configurable visuals
Drill down into any grouped expense by clicking “View”
Choose from bar charts, pie charts, or line graphs for easy interpretation
How it works
Filter: Sort by top spenders, categories, merchants, and time periods to spot trends or risks
Drill down: Click into grouped expenses for immediate visibility into behavior
Save and share: Use saved searches, custom views, and shared deep links for seamless collaboration across teams
Available now in New Expensify. Head to your Home page or Reports tab to start simplifying your workflow and seeing your data more clearly.
Want to see it in action? Check out the demo below.
– Concierge
P.S. Got feedback or questions? Just email concierge@expensify.com. We love hearing from you!