Excel expense tracker: How to track expenses in 5 simple steps
There are three common ways to track expenses: a spreadsheet, a dedicated app, or manual paper records. A spreadsheet (like the free template below) is low-cost and flexible but relies on manual entry; an expense app automates receipt capture and categorization; paper is simplest but hardest to report on. This guide covers the spreadsheet method step by step, then shows when it's worth switching to automation.
Key takeaways
- Excel is a legitimate starting point, not a permanent solution. It's free, flexible, and familiar, but it's also fully manual, which means every hour spent in cells is an hour not spent on the business.
- Manual expense tracking is more expensive than it looks. Processing a single expense report manually costs an average of $58, and 19% of those reports contain errors that cost another $52 each to fix.
- Consistency is the hard part. Most Excel trackers break down not because the setup is wrong, but because nobody keeps them updated when things get busy.
- When your team grows, spreadsheets don't scale. Version control, receipt storage, approval workflows, and realtime reporting all require more than a shared .xlsx file.
- Expensify automates what Excel can't. SmartScan captures receipts instantly, auto-categorization learns your habits, and reports build themselves in realtime.
What is an Excel expense tracker?
An Excel expense tracker is a digital tool designed for tracking and managing expenses using Microsoft Excel. You likely know it as a “spreadsheet,” where users input various expenses under predefined categories, allowing them to track their financial management efficiently.
Who can benefit from using an Excel expense tracker?
Small business owners who need oversight of their budgets and expenses.
Individuals looking to manage personal monthly expenses.
Employees traveling for business who want to track travel expenses systematically.
Freelancers or contractors tracking project expenses.
Accountants handling client expenses.
Your step-by-step guide to creating an expense tracker in Excel
Creating a personal or business expense tracker in Excel is relatively straightforward. Follow these simple steps to organize your monthly expenses, track business expenses, and maintain a healthy cash flow.
Step 1: Create a new Excel workbook
Start by opening Microsoft Excel and creating a new workbook. Click on "File" and then select "New." Choose a blank workbook (some versions already have a blank workbook as a default choice). Save this new file with a relevant name, such as "Expense Tracker 2026," to help you easily identify it later.

Step 2: Set up columns
Next, you’ll want to name the columns for your expense tracker. Common column names/categories include:
Date
Description
Category
Budgeted or projected amount
Actual amount
Difference

Step 3: Input initial data: expense categories, monthly budget, and actuals
Now it's time to fill in your expense tracker with initial data. Start by listing your expense categories. Common categories include rent, office supplies, travel and entertainment (T&E), and utilities. For each category, input your monthly budgeted or projected amount—the estimate of what you expect to spend in a month. Record the actual amounts spent in the appropriate column as you incur expenses.

Step 4: Add formulas to get a summary and totals
Add formulas to calculate totals and find the difference between budgeted and actual expenses. For example:
Use =SUM(cell:cell) to get the total of a column.
Calculate the difference by subtracting the actual amount from the budgeted amount for each category (=Budgeted Amount - Actual Amount).

Step 5: Create a summary sheet and use the data to create charts and graphical representations
Consolidate all your information on a summary sheet. This could be a new tab within your Excel workbook that provides a cumulative view of your expenses. You can then insert charts such as pie charts for expense categories or line charts to track spending over time. This graphical representation makes it easier to analyze your expenses.
To create a chart, highlight the relevant data, go to the "Insert" tab, and choose the chart type that best displays your data. Conditional formatting, pivot tables, and data validation can further enhance your expense tracking for an even more powerful financial tool.

A well-built Excel tracker can genuinely work, especially in the early days when volume is low and flexibility matters more than automation.
The honest caveat, however: maintaining it takes a good amount of time. In fact, employees who rely on manual data entry spend an average of more than nine hours per week on it, and that's before accounting for the errors that need fixing. For a small team tracking a handful of expenses, that's manageable. But for a growing business, it's a cost worth watching.
Consider these while setting up your Excel expense tracker
Here are some other things to consider when setting up your monthly expense tracker in Excel.
Basic features to include
When designing your expense tracker in Excel, certain basic features are key to its functionality:
Date field: Allows you to enter the date of each expense.
Description field: A column for a brief description or memo for the expense.
Amount field: The actual cost incurred necessary for any expense report.
Category field: Enables sorting expenses into predefined expense categories.
Payment method: Tracks whether the expense was paid with credit, debit, cash, etc.

Customizing your expense tracker
After you've included the basic features, you can customize your Excel expense tracker to better fit your financial management needs or the specifics of your business expenses. Here are some ideas:
Add additional columns for client names or project numbers if you're tracking business expenses.
Incorporate an "Approved" column for business use where expenses require authorization.
Tailor your expense categories to reflect unique aspects of your business accounting structure.
Adding formulas for automatic calculations
One of the most powerful aspects of an Excel expense tracker is its ability to automate calculations. Here are some essential formulas to include:
SUM: To calculate expenses within a specific category or time period.
AVERAGE: Useful for understanding average spend per category or month.
VLOOKUP or INDEX/MATCH: Great for linking data across different tables, such as associating expense types with their categories.
Conditional formatting rules: For visual cues, such as highlighting expenses that exceed a certain threshold.
For example, to calculate the total monthly expenditure in a given month, input the formula =SUMIF(DateRange, "Month", AmountRange) where "DateRange" refers to the range of cells that contain the dates, "Month" is the specific month you're totaling, and "AmountRange" is the column of expenses. Use similar formulas to tally expenses by category or identify cash flow irregularities.
Best practices and common pitfalls when it comes to tracking expenses in Excel
To get the most out of your Excel expense tracker, be sure to follow these best practices to avoid common pitfalls.
| Problem | Solution |
|---|---|
| Not updating the tracker regularly, leading to gaps and lost receipts | Set a weekly calendar block to update; review and adjust categories at month end |
| Overcomplicating the setup with too many columns, tabs, or formulas | Start with a simple template; add complexity only when a specific need arises |
| Leaving the file unsecured and accessible to anyone with the link | Password-protect the spreadsheet and restrict sharing to necessary collaborators only |
| Losing data when a file is accidentally overwritten, deleted, or corrupted | Back up to cloud storage (OneDrive, Google Drive) and keep versioned copies |
| Entering data but never analyzing what it means for budget or cash flow | Use pivot tables and charts to spot trends; tie monthly actuals back to budget targets |
Best alternatives to Excel expense tracking
While an Excel expense tracker provides a flexible and familiar platform for managing finances, many alternatives exist that cater to different needs and preferences. Here are some of them:
Expense tracking apps
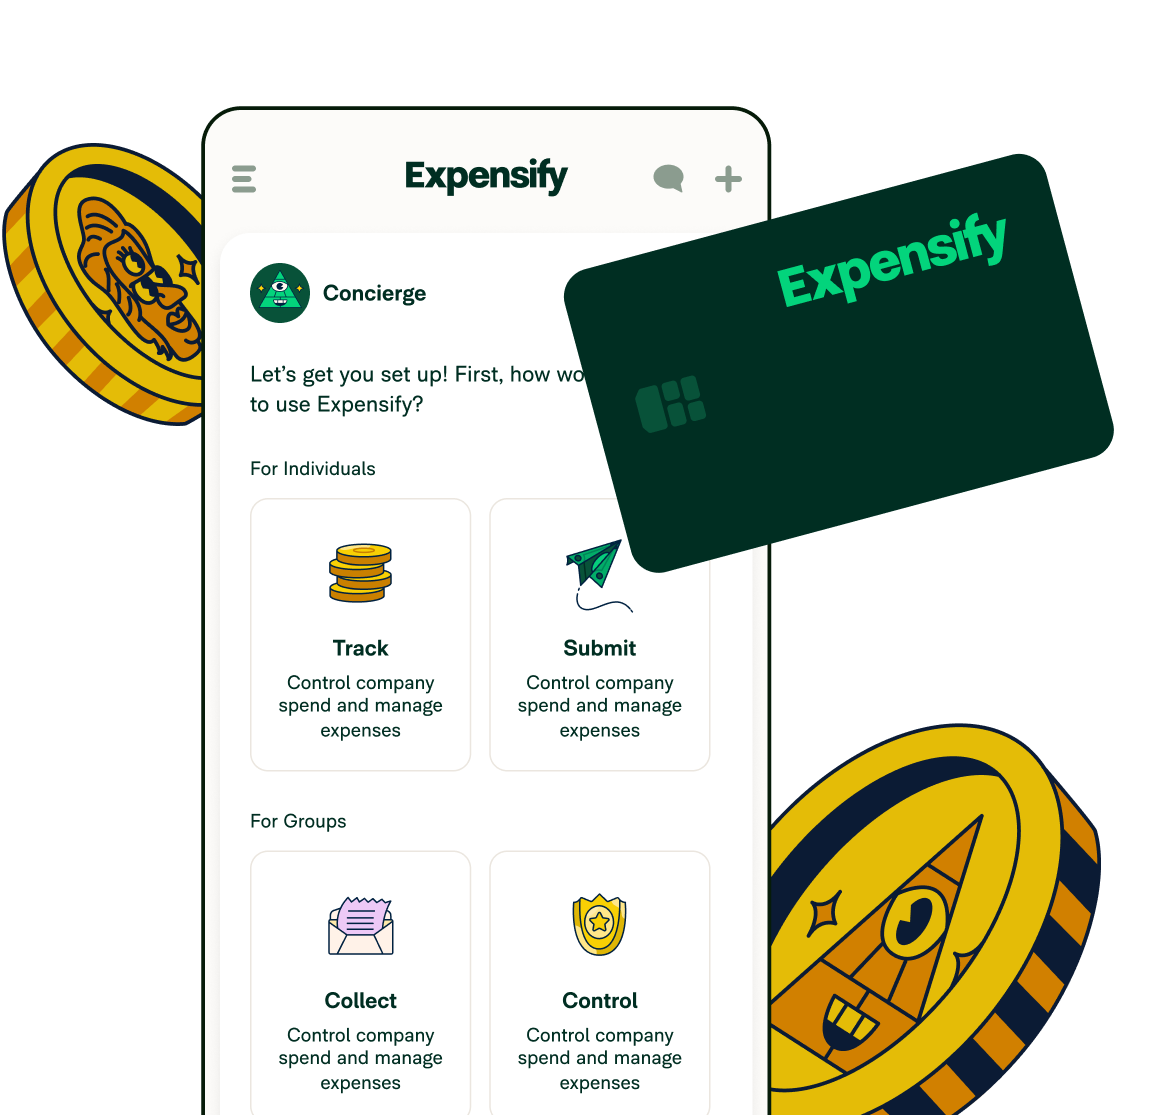
Expense tracking apps have grown in popularity due to their convenience and mobile access. An app like Expensify, for example, streamlines expense capture by allowing users to scan receipts and track mileage with ease. Its user-friendly interface simplifies the expense tracking process, making it a top choice for individuals and business professionals on the go.
User-friendly: Effortless navigation and intuitive design.
Receipt scanning: Keeps track of spending by simply scanning receipts.
Mileage tracking: A useful feature for travel expenses.
Accessibility: Accessible from multiple devices, which suits mobile users.
Online budgeting tools
Online budgeting tools are another solution for those who prefer web-based platforms. These tools track expenses and often provide visual representations of financial health, such as charts and graphs. They can also be synchronized with bank accounts for real-time updates.
Professional accounting software
Professional accounting software is yet another alternative for businesses requiring robust financial tracking capabilities. These platforms typically encompass a range of accounting needs, from expense tracking to invoicing and payroll.
AI-powered expense tracking: Excel vs. Expensify
Excel can do a lot. It can handle formulas, pivot tables, conditional formatting, and charts. But every bit of that power requires a person to set it up, maintain it, and fix it when something breaks. The spreadsheet does what you tell it to and nothing more.
Expensify handles the parts that don't need a person involved, such as:
SmartScan receipt scanning. Snap a photo and Expensify extracts the merchant, date, amount, and currency automatically. No typing required.
Auto-categorization. The more you use it, the smarter it gets, predicting categories based on your spending patterns so you're not babysitting formulas.
Realtime reports. Expense reports build themselves and are ready to export or share without any manual assembly.
Seamless accounting and bank integration. Link your accounts and transactions flow straight in. No CSVs, no cleanup.
Compliance and spend insights. For teams, Expensify flags policy violations, surfaces spending trends, and helps catch errors before they become problems.
This shift away from manual tracking isn't just a product decision but reflects where the market is heading. The global expense management software market was valued at $8.33 billion in 2025 and is projected to reach $17.26 billion by 2034, driven largely by demand for automation and mobile-first solutions.
That’s why businesses are moving to tools like Expensify because the time cost of maintaining them stopped making sense. Once that switch happens, going back to manual entry tends to feel exactly as tedious as it actually is.
If you’re ready to ditch the spreadsheets and automate your expenses, click on the button below and we’ll take it from there.
FAQs about tracking expenses in Excel
-
The best spreadsheet for tracking expenses depends mainly on your personal or business needs, but many people find that Excel is a versatile and powerful tool for this purpose. An Excel expense tracker can be tailored to accommodate a variety of financial management tasks, including monitoring monthly expenses, business expenses, and travel expenses.
-
Customizing an Excel expense tracker is relatively simple. You can adjust it to align with your specific expense categories or the required level of detail. Start by creating columns for dates, amounts, categories, and notes. You can then use formulas to calculate totals and create filters to sort your data. Additionally, Excel allows you to craft pivot tables for dynamic data analysis or use conditional formatting for visual cues regarding your spending habits.
-
It's possible to import existing financial data into an Excel expense tracker. You can typically import data from CSV, other Excel, or even text files. Use the "Get External Data" feature under the "Data" tab to locate and bring in the desired information. Once imported, you can arrange the data into the appropriate columns within your expense tracker template and analyze your spending patterns.
-
Yes, you can share an Excel expense tracker for collaborative purposes. Multiple users can access and edit the tracker by saving your workbook to a cloud or online drive that’s compatible with Excel files. Be sure to manage the permissions carefully to ensure that the file is shared only with designated collaborators to maintain data integrity and privacy.
-
Generating reports and summaries from an Excel expense tracker can be accomplished using pivot tables, Excel's charting tools, or simply by creating summaries using formulas. Pivot tables streamline the aggregation and breakdown of data, allowing for interactive reporting. Charts can be a good choice for visual representation. To create a summary, use the SUM function alongside filters to display totals for specific time periods or categories, making it easier to review and analyze your cash flow and monthly financial overview.
-
For most businesses, the answer comes down to how much manual work they're willing to tolerate.
Expensify's SmartScan technology sits at the top of the category for a reason: point a phone camera at a receipt and it extracts the merchant, date, amount, and currency automatically, no data entry required.
Receipts are stored digitally, matched to transactions, and ready for reporting without any manual sorting.
For teams that deal with high receipt volume like frequent travelers, field teams, and client-facing roles, that kind of automation makes a real difference at the end of the month.
-
Yes, and the efficiency gains tend to show up across the whole workflow, not just receipt capture.
Expensify connects directly to cards and bank accounts so transactions import automatically, categorizes expenses based on spending patterns, and generates reports without requiring manual assembly.
For businesses managing employee spend, Smart Limits let admins set controls tied to actual bank balances, and policy rules can flag or block out-of-policy expenses before they hit a report.
The result is less time spent on expense admin at every level, for employees submitting, managers approving, and finance reconciling.